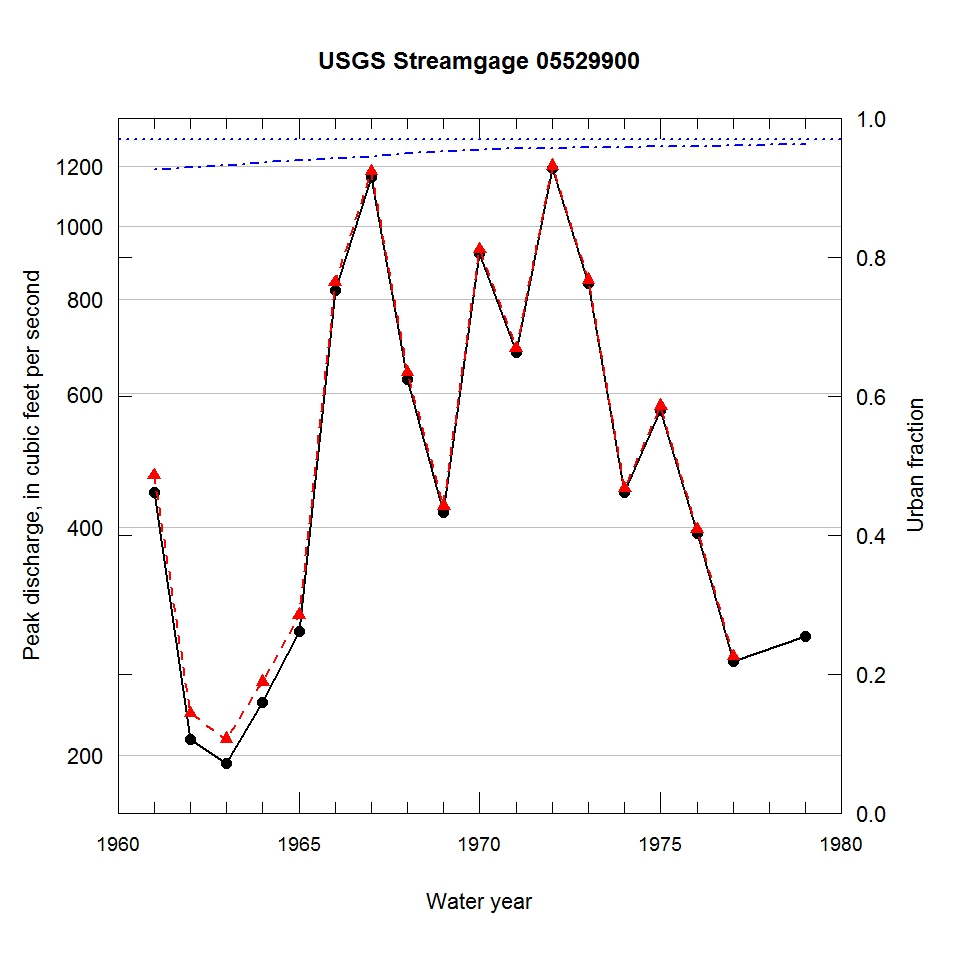
Observed and urbanization-adjusted annual maximum peak discharge and associated urban fraction and precipitation values at USGS streamgage:
05529900 WELLER CREEK AT MOUNT PROSPECT, IL


| Water year | Segment | Discharge code | Cumulative reservoir storage (acre-feet) | Urban fraction | Precipitation (inches) | Observed peak discharge (ft3/s) | Adjusted peak discharge (ft3/s) | Exceedance probability |
| 1961 | 1 | -- | 0 | 0.926 | 0.936 | 444 | 468 | 0.627 |
| 1962 | 1 | 4B | 0 | 0.929 | 0.372 | 210 | 227 | 0.973 |
| 1963 | 1 | -- | 0 | 0.932 | 1.552 | 195 | 210 | 0.981 |
| 1964 | 1 | 2 | 0 | 0.935 | 0.455 | 235 | 250 | 0.962 |
| 1965 | 1 | -- | 0 | 0.939 | 0.685 | 291 | 306 | 0.928 |
| 1966 | 1 | -- | 0 | 0.942 | 1.150 | 821 | 842 | 0.123 |
| 1967 | 1 | -- | 0 | 0.945 | 1.540 | 1160 | 1180 | 0.033 |
| 1968 | 1 | -- | 0 | 0.949 | 1.296 | 627 | 640 | 0.290 |
| 1969 | 1 | -- | 40 | 0.952 | 0.835 | 418 | 427 | 0.720 |
| 1970 | 1 | -- | 40 | 0.955 | 1.256 | 919 | 931 | 0.080 |
| 1971 | 1 | 2 | 40 | 0.956 | 0.372 | 680 | 689 | 0.229 |
| 1972 | 1 | -- | 40 | 0.957 | 1.065 | 1190 | 1200 | 0.031 |
| 1973 | 1 | 2 | 140 | 0.957 | 0.809 | 840 | 849 | 0.119 |
| 1974 | 1 | -- | 140 | 0.958 | 1.017 | 444 | 450 | 0.670 |
| 1975 | 1 | -- | 140 | 0.959 | 1.008 | 571 | 578 | 0.418 |
| 1976 | 1 | -- | 140 | 0.959 | 0.829 | 392 | 397 | 0.776 |
| 1977 | 1 | -- | 140 | 0.960 | 1.273 | 266 | 270 | 0.953 |
| 1979 | 0 | -- | 270 | 0.962 | 0.877 | 287 | -- | -- |

